Since 1928 when the Conowingo Dam was first built, sediment has built up behind the 95 foot tall concrete structure. Today, the dam holds back 174 million tons of sediment, releasing an average of 1.5 million tons/year. Although there has been no controlled release experiment at the Dam, we have some idea of what would happen if the sediment was released based on suspended sediment data during hurricanes and tropical storms. Concerns arise over releasing the sediment due to its high concentrations of nutrients, heavy metals, and toxins. Engineering may allow us to reuse the sediment, lock in the pollutants, and benefit economically from a complex ecological problem.
Sediment Characteristics in the Conowingo Reservoir and Impacts of Sediment Release on the Chesapeake Bay via 9 miles of the Susquehanna River.
|
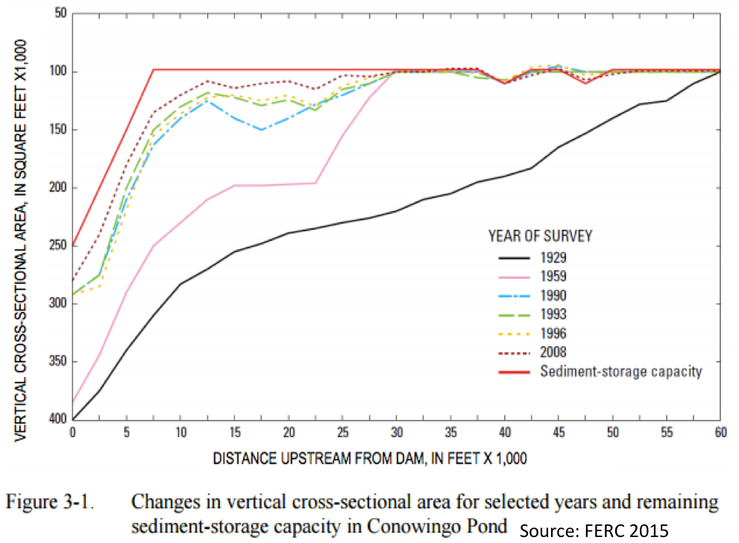
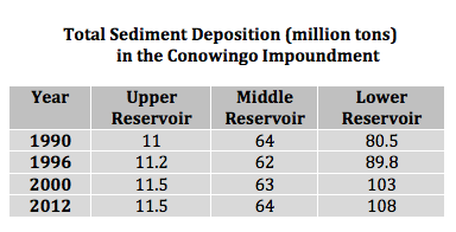
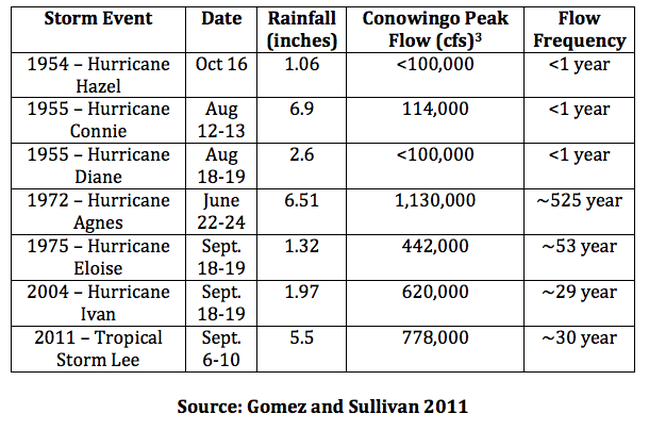
The Conowingo Dam functions as a “pollution gate” (LSWRA.FAQ, 2015), resulting in the buildup of sediment over time to a current state of static equilibrium. About 174 million tons of sediment is trapped in the Conowingo impoundment at any given time with about 3 million tons fluctuating in and out of the system every year. During periods of low flow between large storms, sediments accumulate behind the dam. During large storm events, the “pollution gates” are opened and suspended sediment flows out of the reservoir downstream to the Chesapeake Bay. This means that the stream flow from the Conowingo generally has low turbidity and suspended sediment with short periods of very high suspended sediment during storm events, shocking the downstream ecosystems temporarily.
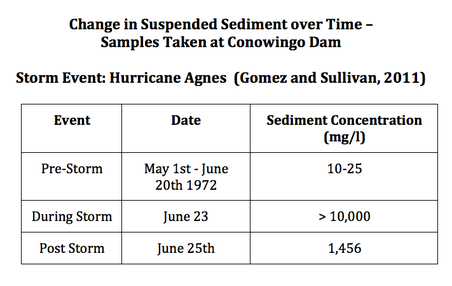
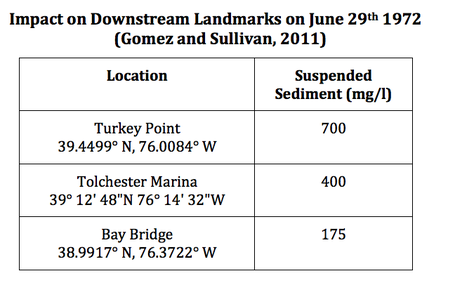
The Susquehanna releases ~1.5 million tons of sediment in a normal year. After Hurricane Agnes in June 1972, ~ 30 million tons of high nutrient sediment flushed into the Bay settling out in thick deposits. In the years following Agnes, oysters and underwater grasses died off (67% decline in underwater vegetation) (Brainard 2011). In 2011, Tropical Storm Lee hit in September. The Chesapeake was inundated with sediment, and the water remained turbid until November. Since this storm hit much later in the growing season, the aquatic vegetation was largely left intact after the storm, in contrast to the aftermath following Hurricane Agnes when vegetation was still young and less resilient (Brainard 2011). Examples from other rivers can also help inform decision making. The Newaygo Dam on the Muskegon River was removed before spring run-off to limit the negative impact of stored sediments flowing downstream. It is also important to take spawning and breeding habitats of native species into account so that the sediment is not released during a critical part of the reproductive process (Higgs 2002). These case studies show that timing of sediment inundation is critical when evaluating ecological damage following storm events. Lessons from these natural disasters can help inform decision making regarding the timing of the release of sediments from the Conowingo impoundment. |
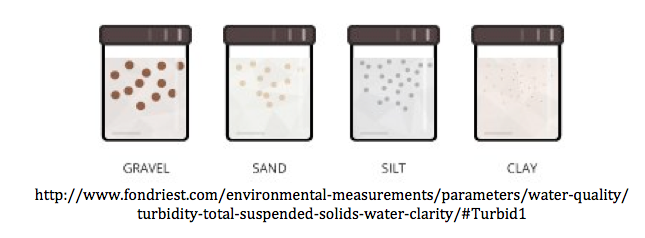
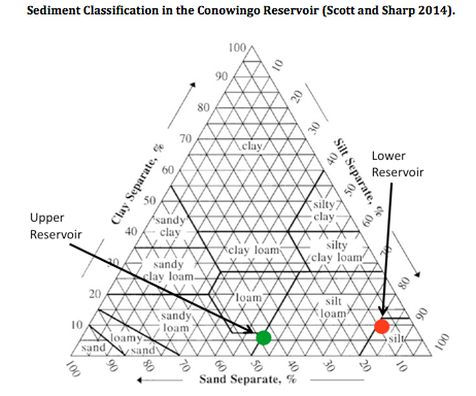
The lower reservoir of the Conowingo impoundment is composed of 10% sand, 9% clay, and 81% silt and is classified as silt. The upper reservoir is composed of 45% sand, 5% clay, and 50% silt and is classified as silt loam (Scott and Sharp, 2014). The high clay and silt concentrations in the lower reservoir are important to note because clay and silt are more easily transported by flowing water during storms than sand and small rocks. Clay is the finest (smallest) grain sediment and requires less energy to move long distances. Therefore during storms, more of the smaller grain particles will get picked up and deposited downstream (Chesapeake Bay). See soil classification diagram to the right.
|
|
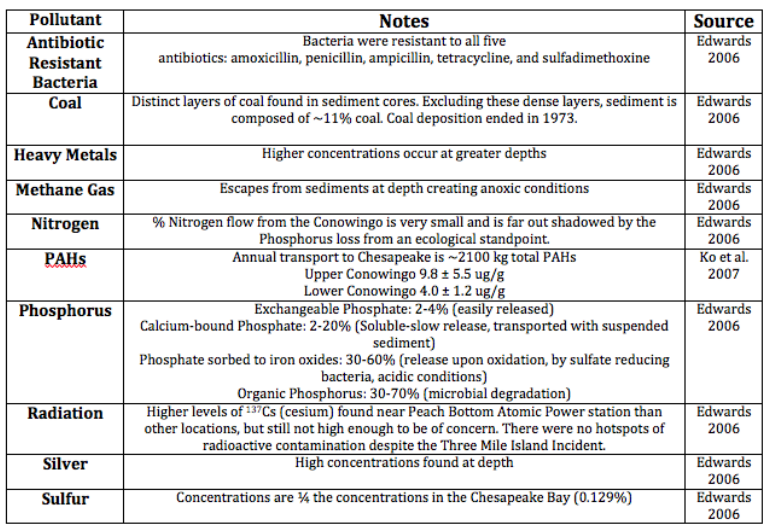
The sediment is contaminated with a variety of toxins and nutrients, complicating dredging efforts and posing increased risk to downstream ecosystems after storms. See below for a list of contaminant concerns. Of great concern are PAHs and PCBs that are trapped in the sediments and are slowly being transported to the Chesapeake when sediments are disturbed. Phosphorus, which binds to silt particles, travels with transported sediments; its release from the impoundment is also of concern due to increased eutrophication caused by this limiting nutrient.
Table. Susquehanna River contaminants of concern.
Table. Susquehanna River contaminants of concern.
A small volume of sediment from behind the Conowingo impoundment could be released into the Chesapeake on an annual basis while keeping the volume of sediment entering the Chesapeake below the annual TMDL of 6.45 billon lbs of sediment. At the current sediment loss of 1.5 million tons/year, sediment lost from the Conowingo impoundment represents 3 billion lb/year of the 6.45 billion tons allowed. If sediment loss from other parts of the Chesapeake watershed can be reduced through improved land management practices, more sediment can be safely released from the Conowingo Reservoir without exceeding TMDL levels (EPA 2015).
Options for Removing and Repurposing 174 Million Tons of Sediments Trapped Behind the Conowingo Dam
Sediment from behind the dam can be removed and used for multiple purposes. These options operate under the assumption that dredging the sediment and dumping it in a toxic waste site is not a responsible solution to the problem.
- Pump (fluid sediments) in a pipeline over the dam and down the 9 miles of river to the mouth of the Chesapeake where it could be transported in barges (a typical barge can hold 1500 tons of sediment) and geo-engineered to build up certain key areas such as some of the mid-Bay islands, so that they do not disappear as sea levels rise. This fine sediment is high in nutrients and is easily erodible if it isn’t engineered to stay in place. Geotubes compact sediments which could be used to build dikes/sea wall in low lying areas downstream of the dam (Geotube®)
- Sediment can also be used to create artificial marsh land around these islands as a buffer zone to protect islands as storms become more intense and sea levels rise.
- Artificial River Delta - build up sediments and plant reeds to stabilize the system.
- Deliberate Sediment Accumulation in a specific section of the Chesapeake to build a delta that is carefully controlled and planted. These structures can be thought of as "underwater forests" in which the plant species capture sediment as it flows through, acting as filters. Build these artificial deltas at the mouth of the Chesapeake and create buffer zones around islands. These deltas will get washed out during large storms, but sediment flowing down the Susquehanna will re-nourish them over time.
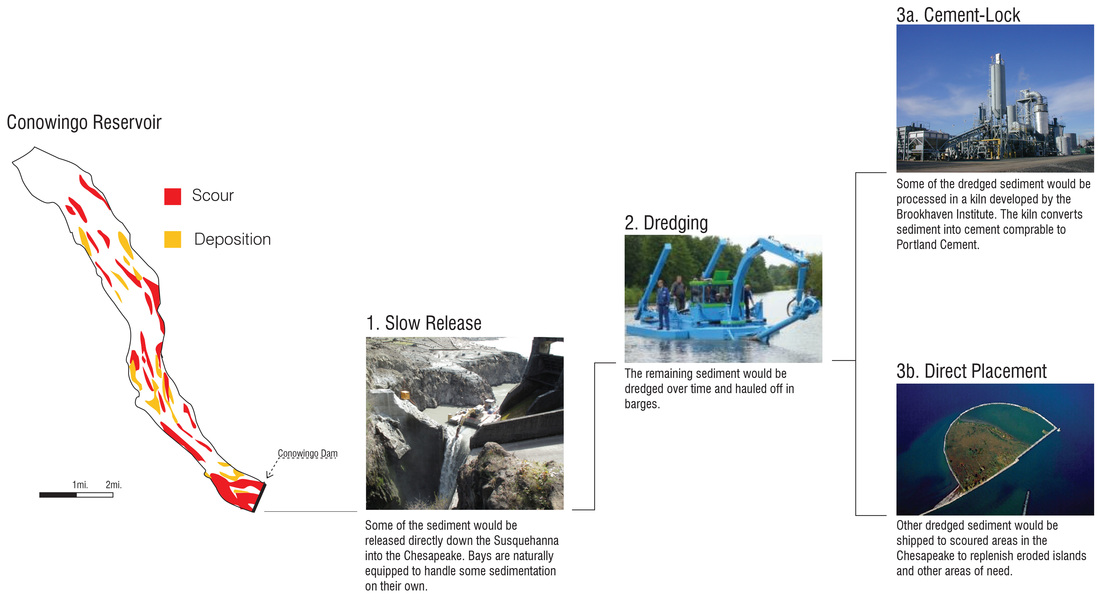
- The Brookhaven Institute has developed Cement Lock® Technology that converts contaminated sediment to a building material called Ecomelt (non crystalline remediated product).
- This Ecomelt can be made up of contaminated sediment from behind the dam. The sediment is filtered to take out particles above ¼ inch. This remaining sediment is then dewatered before it can be converted into cement using a ratio of 40% Ecomelt / 60% Portland Cement (Mesinger and Sheng 2006). Past processing plants have been built to process 500,000 yd^3/year (382,277.43 m^3/year). Given that there are an estimated 158.26 - 187.03 million yd^3 (121 – 143 million m^3)of sediment behind the dam, we may need to build a plant with a larger capacity (Mesinger and Sheng 2006).
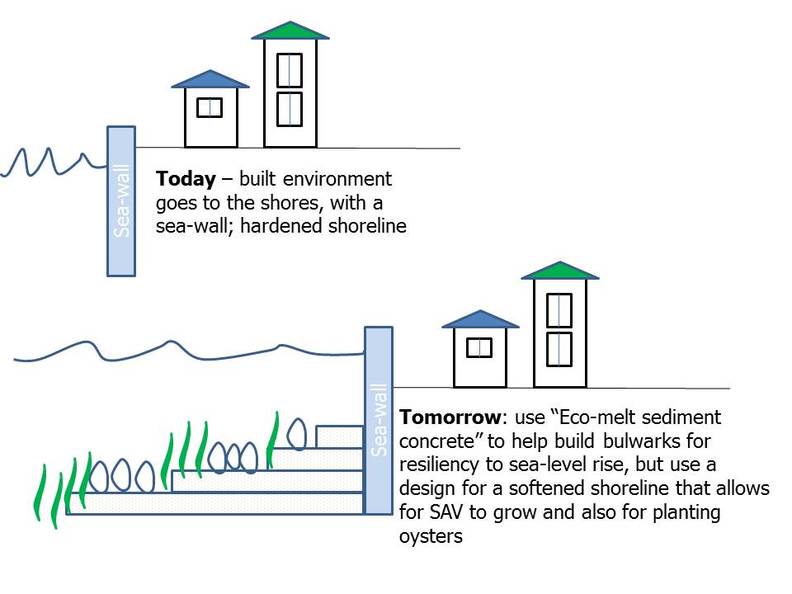
- This material can be used to create terraces on shorelines to use as flood control or taken offshore and used to rebuild sidewalks and other building structures. Within the terraces, build artificial habitats (e.g. substrates for oyster restoration, submersed aquatic vegetation beds, etc.) can be constructed. We recommend filling in these terraces with high nutrient sediment; research can be conducted to test the release rates of nutrients, but also plants and animals that potentially can take up these nutrients can be established in the beds.
Proposed Flow of Sediments
Cost Analysis
The U.S. Army Corps of Engineers has evaluated removal of sediment from the Conowingo reservoir from a variety of perspectives, investigating different methods of dredging and more holistic watershed wide land management strategies. The Conowingo Impoundment is already full of 174 million tons of sediment with an estimated 3 million tons entering the system annually. According to the U.S. Army Corps of Engineers, dredging the Conowingo Reservoir to keep the sediment at current levels would cost $16 - 89 per cubic yard or $48 - 267 million/year (LSRWA 2014). Dredging alone is not a realistic long-term solution to the sediment build up problem. Another option would be to invest $1.5 – 3.5 billion in land restoration to prevent the sediment from being lost to the Susquehanna in the first place. This would be a one time investment and solve many water quality related problems for decades (LSRWA 2014).
Even with land management to reduce sediment deposition in the Conowingo reservoir, existing sediment will likely need to be dredged in order to remove the dam for limited downstream ecological impact. This dredged sediment could at great cost be transported to a toxic waste dumpsite, or it could be recycled into Ecomelt and sold as a building material. In order for this strategy to work, a processing plant would need to be built on site near the Conowingo Reservoir to minimize transportation costs. Cement Lock® estimates that the cost of building an Ecomelt plant is around $81 million. Given that Ecomelt can be sold for $80 per cubic yard, the cost of building the plant would be recouped over 20 years (Mensinger and Sheng 2006).
Even with land management to reduce sediment deposition in the Conowingo reservoir, existing sediment will likely need to be dredged in order to remove the dam for limited downstream ecological impact. This dredged sediment could at great cost be transported to a toxic waste dumpsite, or it could be recycled into Ecomelt and sold as a building material. In order for this strategy to work, a processing plant would need to be built on site near the Conowingo Reservoir to minimize transportation costs. Cement Lock® estimates that the cost of building an Ecomelt plant is around $81 million. Given that Ecomelt can be sold for $80 per cubic yard, the cost of building the plant would be recouped over 20 years (Mensinger and Sheng 2006).
Sources/Further Reading
Brainard, Jeffrey. 2011. Big Year for Bay Storms, Bad Year for Bay Sediment? Tropical Storm Lee Flushed Sediment into the Bay, but scientists question its effect. Chesapeake Quarterly. Accessed Nov 27, 2015, http://www.chesapeakequarterly.net/V10N4/main1/
Edwards, Robert, E. 2006. Hydroelectric Dams of the Lower Susquehanna River. Watershed Assessment and Protection Program: Susquehanna River Basin Commission (SRBC).http://www.srbc.net/pubinfo/techdocs/Publication_239/CompAnalysisRpt.pdf
EPA (Environmental Protection Agency). 2015. Chesapeake Bay Total Maximum Daily Load (TMDL). Fact Sheet. Geotube® Dewatering Technology. TenCate. Geosynthetics. Accessed Nov 24, 2015, http://www.tencate.com/amer/geosynthetics/solutions/dewatering_technology/default.aspx
Federal Energy Regulatory Commission (FERC). 2015. Final Multi-Project Environmental Impact Statement for Hydropower Licenses: Susquehanna River Hydroelectric Projects. FERC/FEIS-0255F. Accessed on Dec 11, 2015. file:///Users/alison/Downloads/20150311-4005(30315510).pdf
Gomez and Sullivan Engineers, P.C. May 2011. Sediment Introduction and Transport Study RSP 3.15. Conowingo Hydroelectric Project. FERC Project Number 40. http://www.exeloncorp.com/assets/energy/powerplants/docs/Conowingo/Conowingo_RSP_3.15_Part1.pdf
Hainly, R.A., et al. 1995. Deposition and simulation of sediment transport in the Lower Susquehanna River Reservoir System: U.S. Geological Survey Water-Resources Investigations Report 95-4122, 39 p.
Higgs, Stephen. 2002. The Ecology of Dam Removal: A Summary of Benefits and Impacts. American Rivers. Maclin, Elizabeth, and Margaret Bowman eds. Accessed on Dec10, 2015, http://www.michigandnr.com/PUBLICATIONS/PDFS/fishing/dams/ecologyofDamRemoval.pdf
Hirsch, Robert, M. 2012. Flux of Nitrogen, Phosphorus, and Suspended Sediment from the Susquehanna River Basin to the Chesapeake Bay during Tropical Storm Lee, September 2011, as an Indicator of the Effects of Reservoir Sedimentation on Water Quality. U.S. Geological Survey Scientific Investigations Report 2012-5185. 17 p.
Ko, Fung-Chi, Joel Baker, Meng-Der Fang, Chon-Lin Lee. 2006. Composition and distribution of polycyclic aromatic hydrocarbons in the surface sediment from the Susquehanna River. Chemosphere 66: 277-285.
Langland, M.J., and Hainly, R.A., 1997, Changes in bottom surface-elevations in three reservoirs on the Lower Susquehanna River, Pennsylvania and Maryland, following the January 1996 flood - implications for nutrient and sediment loads to Chesapeake Bay: U.S. Geological Survey Water-Resources Investigations Report 97-4138, 34 p., 3 pls.
Langland, Michael J. 2009. Bathymetry and Sediment-Storage Capacity Change in Three Reservoirs on the Lower Susquehanna River, 1996-2008: U.S. Geological Survey Scientific Investigations Report 2009-5110. 21 p.
LSRWA. 2014. Lower Susquehanna River Watershed Assessment, Maryland and Pennsylvania: Phase I. October 2014 Draft.
http://dnr.maryland.gov/bay/lsrwa/docs/report/LSRWADraftMain20141010.pdf
LSWRA. 2015. Lower Susquehanna River Watershed Assessment FAQ: Conowingo Dam & the Chesapeake Bay. US Army Corps of Engineers, Baltimore District.
Mensinger, Michael C., and Robert Sheng. 2006 ENDESCO Clean Harbors LLC. Sediment Decontamination Demonstration Program: Cement-Lock® Technology Phase I Pilot Test. Final Report.
Moyer, D.L., Hirsch, R.M., and Hyer, K.E., 2012, Comparison of two regression-based approaches for determining nutrient and sediment fluxes and trends in the Chesapeake Bay watershed: U.S. Geological Survey Scientific Investigations Report 2012-5244, 118 p.
Scott, Stephen H. and Jeremy A. Sharp. 2014. Sediment Transport Characteristics of Conowingo Reservoir. US Army Corps of Engineers. The US Army Engineer Research and Development Center.
Stroud, Peter L. 2012. Sediment Strategies: Choosing a Sediment Management Option for Dam Removal. Hydro Review. Oct. 1. HydroWorld.com. Accessed on (Sept. 22nd 2015). http://www.hydroworld.com/articles/hr/print/volume-31/issue-07/articles/sediment-strategies-choosing-a-sediment-management-option-for-dam-removal.html
Thompson, Dani Shae. Report: Nutrients, Not Just Sediment At Conowingo, Affect Chesapeake Bay. Capital News Service.
http://cnsmaryland.org/2014/11/14/report-nutrients-not-just-sediment-at-conowingo-affect-chesapeake-bay/
“Turbidity, Total Suspended Solids & Water Clarity.” Fundamentals of Environmental Measurements. http://www.fondriest.com/environmental-measurements/parameters/water-quality/turbidity-total-suspended-solids-water-clarity/
USGS (U.S. Geological Service). Changes in Sediment and Nutrient Storage in Three Reservoirs in the Lower Susquehanna River Basin and Implications for the Chesapeake Bay. Accessed on Sept 22nd 2015, http://pa.water.usgs.gov/reports/fs003-98.html
USGS (U.S. Geological Service). 2014. Lower Susquehanna River: Integrated Sediment and Nutrient Monitoring Program. Prepared by: Exelon, Maryland Department of Natural Resources, Maryland Department of the Environment, US Geological Survey, University of Maryland Center for Environmental Science, US EPA Chesapeake Bay Program, and the US Army Corps of Engineers.
"USGS Fact Sheet 003-98." USGS Fact Sheet 003-98. Web. 18 Dec. 2015.
